

Dashboard and statistics
What the dashboard shows and which key figures the extended statistics provide.
The dashboard
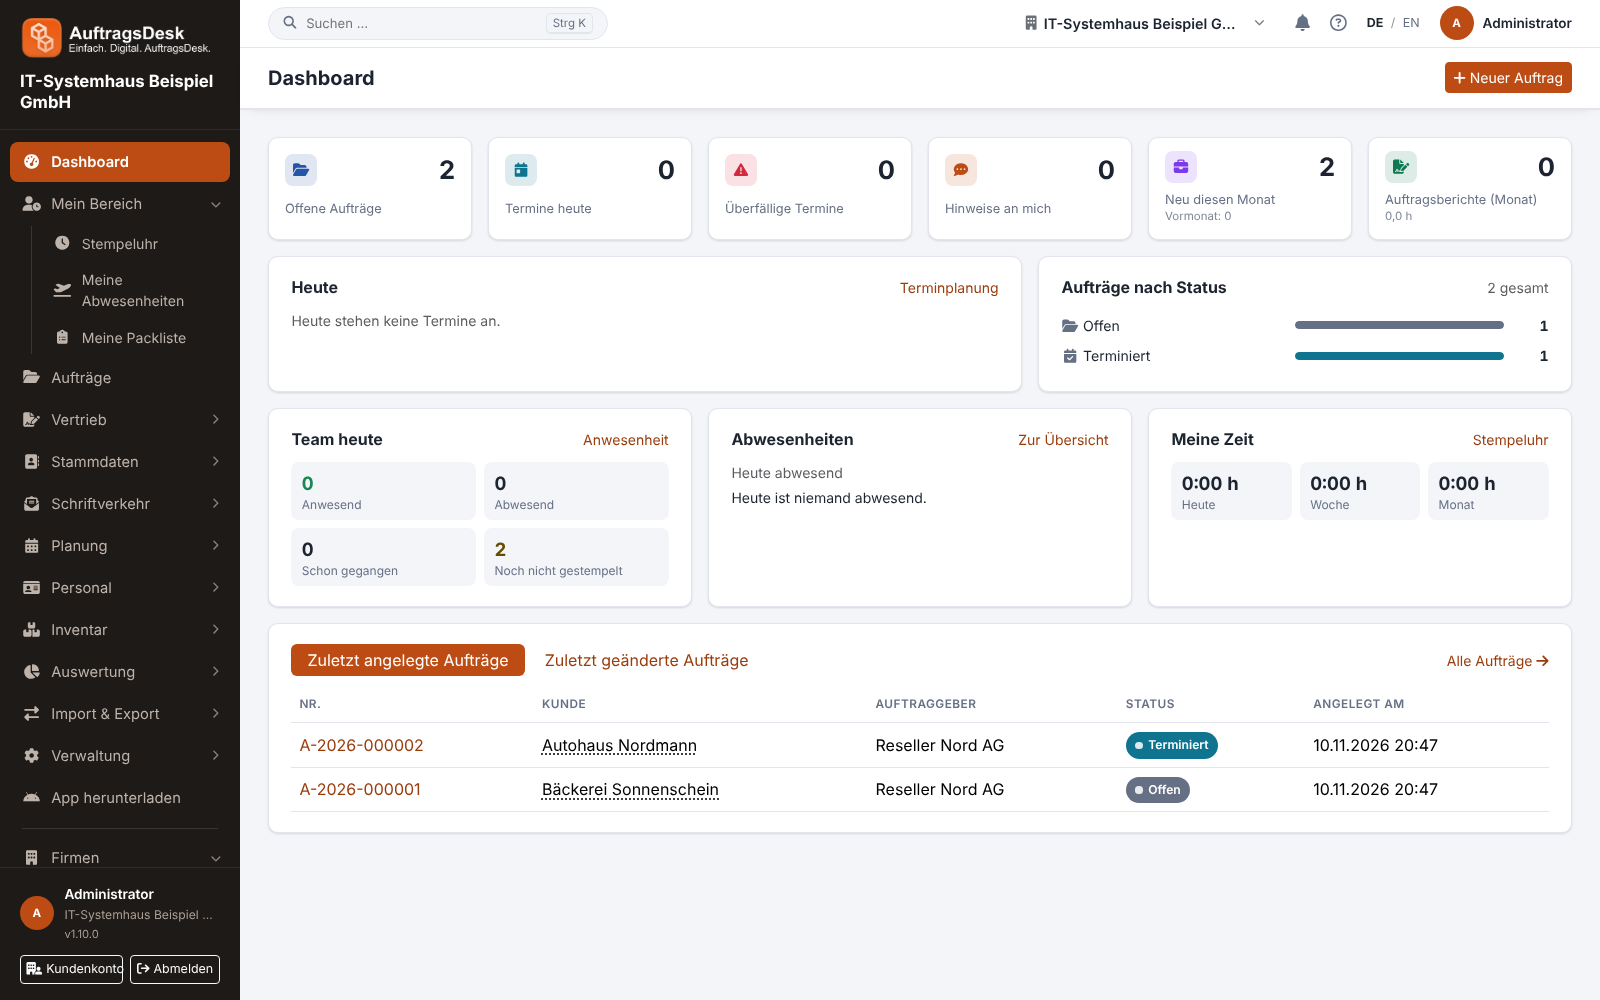
The dashboard is the start page after login and included in every plan. It shows the most important figures of the day: open orders and today's orders, upcoming appointments and notices such as new work instructions or queries.
Extended statistics
Under Analysis → Statistics you find more detailed analyses with charts. The numbers are also shown as a table below each chart.
| Analysis | Purpose |
|---|---|
| Orders by status | How much is open, in progress, completed? |
| New orders per month | Spot seasonality and growth |
| Orders per client | Who brings how much work? |
| Lead time per client | Average time until completion |
| Working hours per employee | hours in the current month |
| Work reports and documents | count and recorded hours |
You need the "View statistics" permission.
Whether an individual order paid off is shown by job costing.